Monitoring queries in EDC/CDMS
Table of Contents
The 'Monitoring' module allows monitors to create data queries for fields in a study. These data queries or queries are issues the monitor has identified with the value entered in a field.
Queries need to be closed for a participant to be marked as complete.
This module is only available for studies that are using the additional Monitoring package.
When the Monitoring module is enabled in a study, administrators can review all open and closed queries on the monitoring tab.
Users with only data-entry rights can see all queries for a participant within the participant (data-entry), on the participant's 'Monitoring' tab.
To enable monitoring in your Study, follow these steps:
- Navigate to the Settings tab.
- In the Study sub-tab, navigate to Study Properties
- Check the box to enable the Monitoring feature.
-
Save the changes.
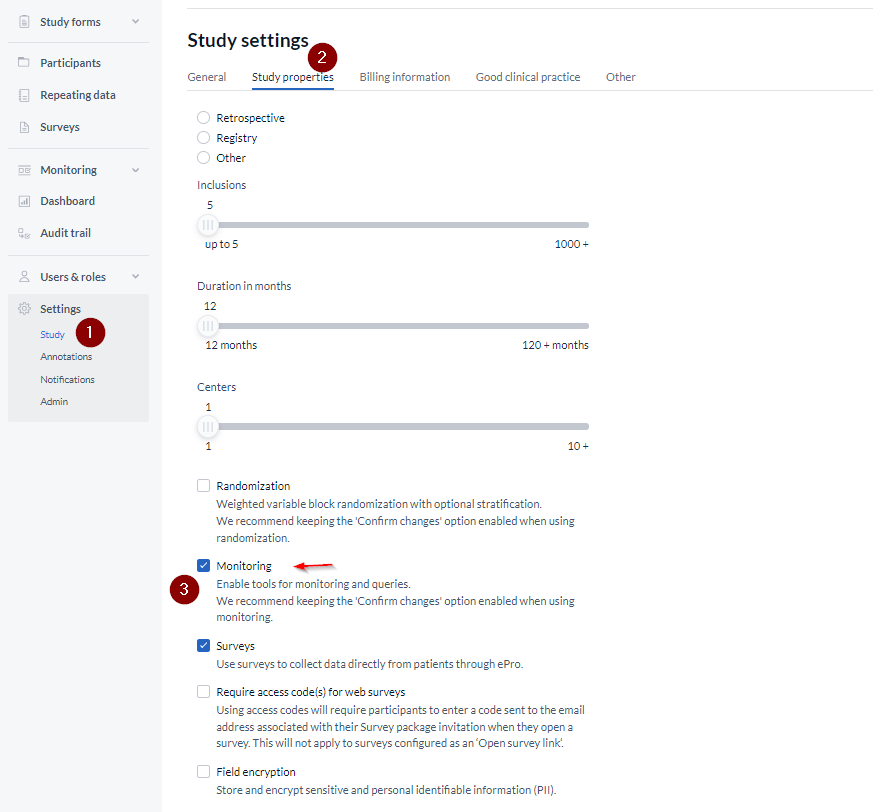
The 'Monitoring' dropdown is disabled for all studies that have at least one open query already created and have been set to ‘live’ to prevent inconsistencies between the study settings and the collected data.
In all other circumstances, users can freely turn the Monitoring feature on and off.
Add data queries to a field
Data queries can only be created by users with the 'Query' right.
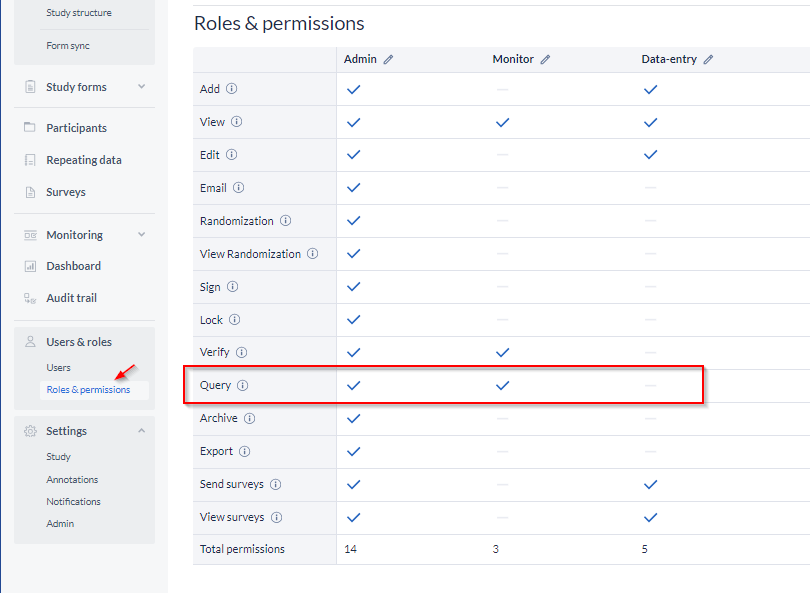
To create a query for a field:
- Enter the data entry view
- Click on the cogwheel next to the field you wish to add a query for.
- Choose Add query from the presented options:

- Add the necessary details in the Remark box
- Click on Add query to finish the process
You can also add multiple queries to the same field allowing them to be simultaneously managed by monitors on single data points (fields).
The query window
When creating a new query, the query window will have the following items:
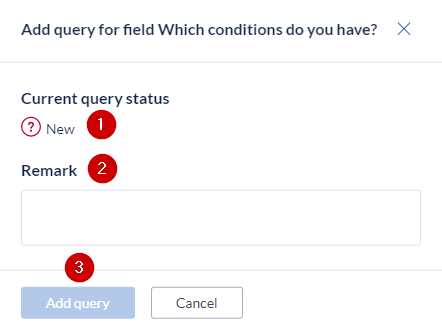
- The current query status.
- Remark (empty for a new query): This is where you enter a remark that you have for this field.
- The 'Add query' button, saves the query and closes the query window.
Every time a new query is added, it gets an incremental number (eg. Query 1, Query 2, Query n+1) so that users can differentiate while responding to them and/or updating their status.
At the field level, you will be able to identify a counter bubble for queries, similar to the one existing on the participant's overview table, to indicate how many queries are still active (not in status ‘closed’).

The query icon also appears on the participant list in the Query column, so any researcher (non-monitor) can see there is an issue with the participant. This column displays the number of unclosed queries in a participant.

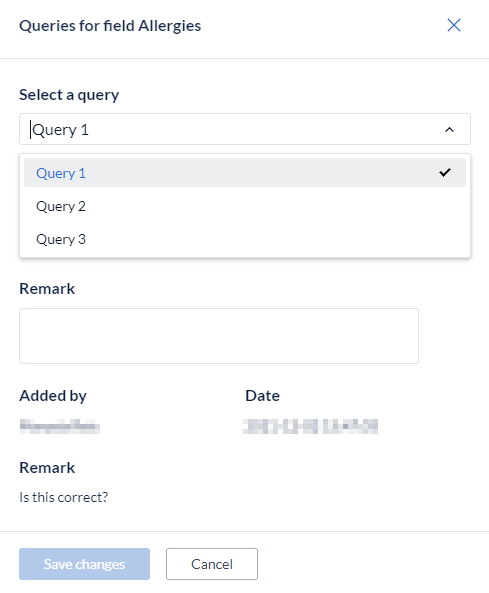
The field queries can be easily opened in a modal dialog that permits checking the history of added remarks (4), changing the status (2), and add a new remark (3) for each of the available queries of one specific field.
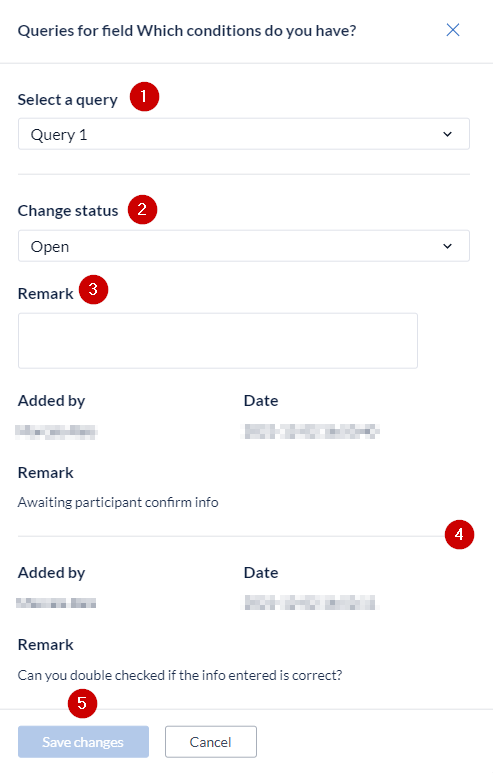
- Select a query: Select the query that you want to update.
- Change status: Allows to change the status of the query.
- Remark: Field to add comments related to the query.
- Query history: You will be able to see all the updates made for that query.
- Save changes: To save the changes made on the query.
Viewing and answering queries from a single participant
Now that a query has appeared on the participant list, a researcher (usually the person who added the participant) should resolve it.
To answer/resolve a query:
- Open the participant
- Click on the 'Monitoring' tab.
Note: The monitoring tab (inside a participant) shows all queries that are present for the current participant:
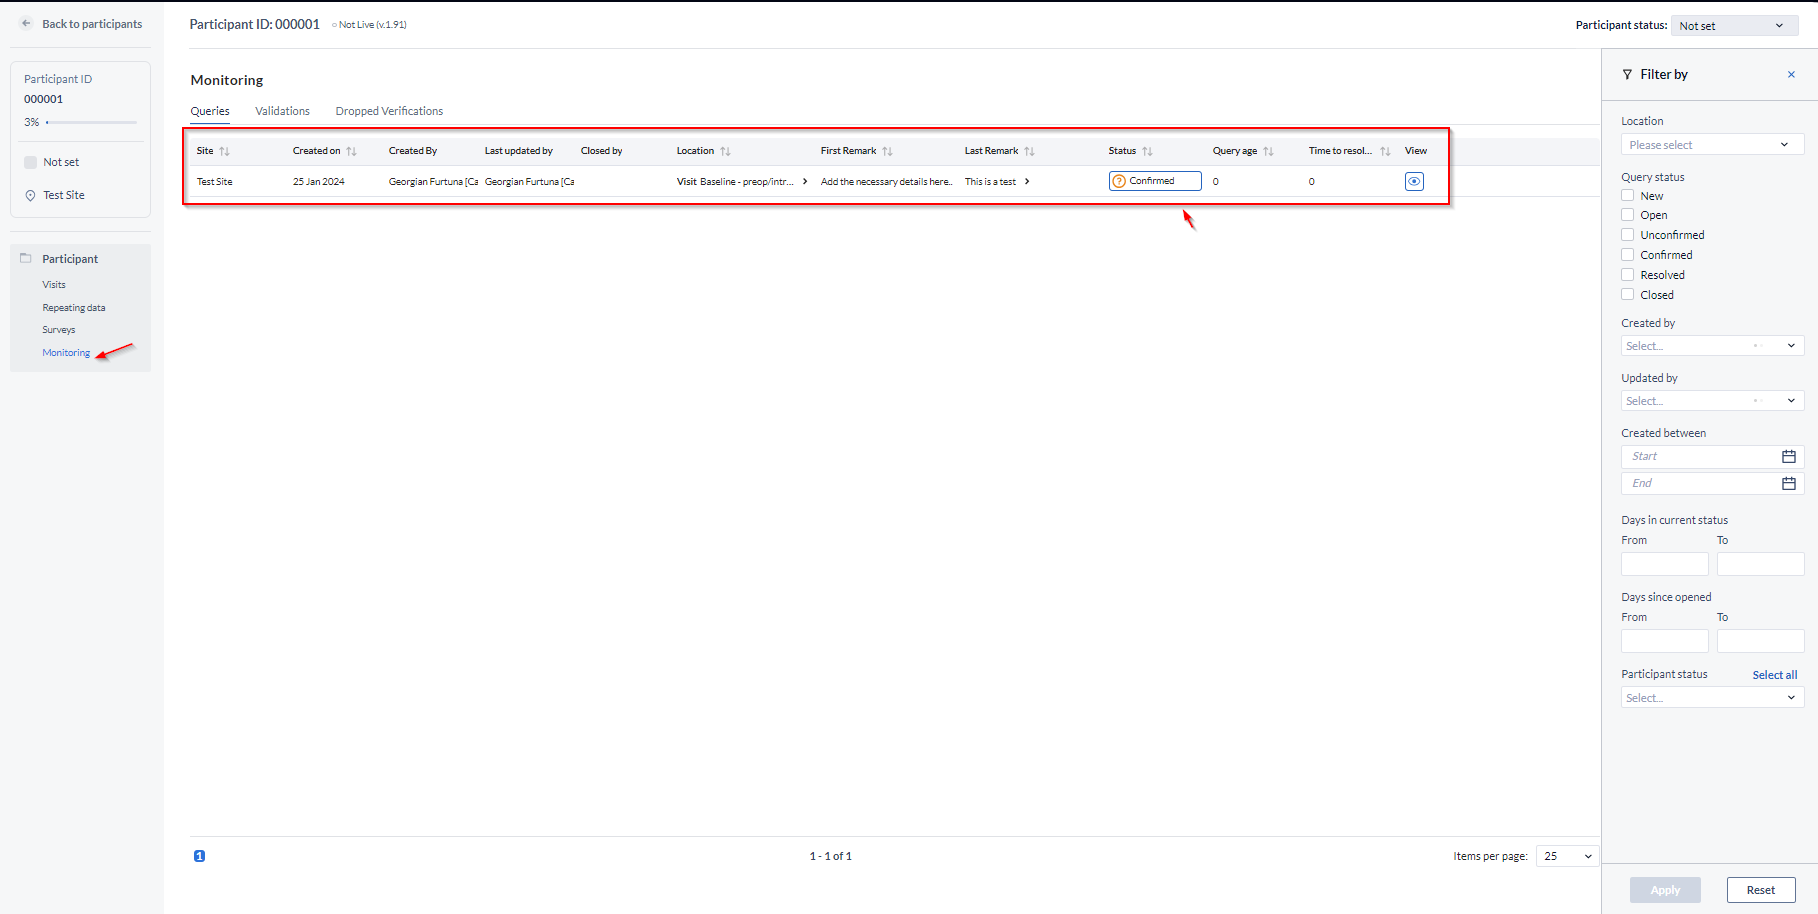
Queries can be filtered as needed, from the filters menu.
Remarks in queries are viewed by clicking on the status icon. Clicking on the eye icon will directly open the form that the field is.
Queries can also be filtered by ‘’Participant status''. This also aligns with the filters used in the ‘’Queries'' section of the Study Dashboard.
Updating the query status
When an existing query is opened, the status is set as New.
A normal user can either set the status to:
- Open: The user has acknowledged/opened the query, and added a remark. The status changes from New to Open.
- Unconfirmed: The user does not agree with the monitor.
- Confirmed: The user agrees with the monitor and will try to resolve the issue.
- Resolved: The user has changed the value and indicates the issue is resolved, for example, the user has reacted to a query and left a comment. In this case, the query is not closed which is why the form status is shown as amber, and not green - the query is still open.
- [Only with 'Query' right (monitor)] Closed: The monitor indicates the issue is resolved and marks the query as closed. The query icon will turn into a green check mark and the progress button of the entire form will be green indicating that the form has been completed - all data entered and there are no open queries.
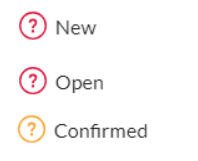
The icon that is displayed next to the field with the query or in the Monitoring tab displays the status of the query:
-
Open/Unconfirmed/Confirmed.
-
Resolved.

-
Closed.

The status can only be changed when accompanied by a remark.
To update the status of a query, please choose the appropriate status from the drop-down, enter your remark, and press the 'Update' button.
Queries
In this overview, unlike the query overview in a single participant, the participant IDs are listed - only participants who have queries attached to them are shown along with additional information.
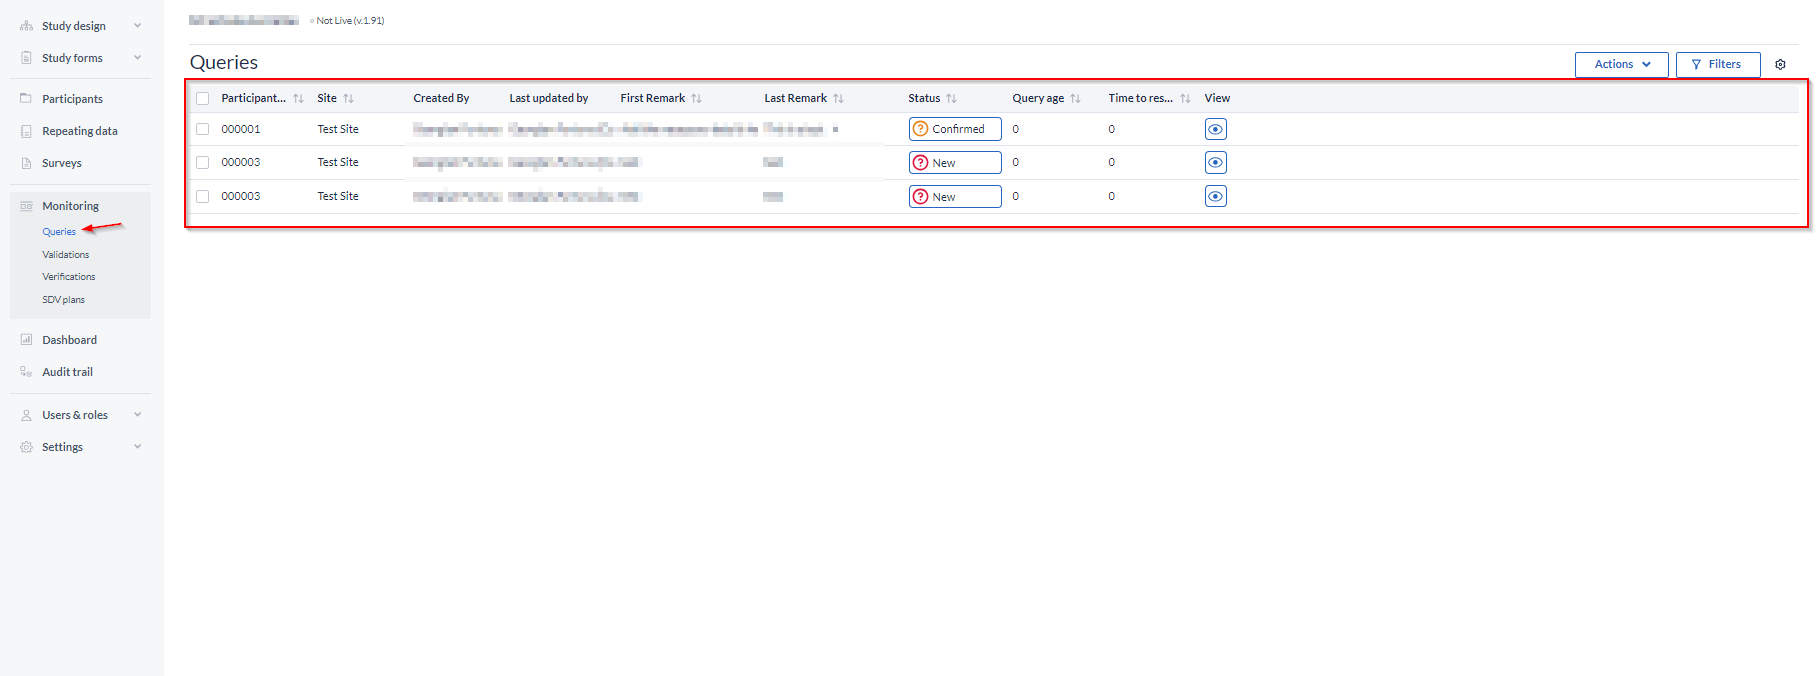
Participant ID - ID of a participant where a query has been created
Site - the site to which the participant is linked
Created on - date and time when a query is created
Created by - the user who created a query
Last updated by - the last user who updated a query
Closed by - the user who closed a query
Location - location of the field where a query was raised. Clicking on the arrow icon > allows you to expand the location and see the Visit, form and field labels where the query was created.
First Remark - initial comment that was added when creating a query
Status - status of a query. Clicking on the query status will open the query window where you can update the query.
Query age - how long ago was a query created
Time to resolve - time that requires to resolve a query
View - click on the eye icon to view the query in the form where it was created
The row selection and the Participant ID columns are fixed to the right side of the table users to easily navigate to the right and left of the table without losing sight of the query row.
'Actions' and 'Filters' menus contain counter bubbles to better understand how many filters have been applied to the current table view, as well as how many table rows have been selected, regardless if these are visible or hidden due to concomitantly applied filter criteria.
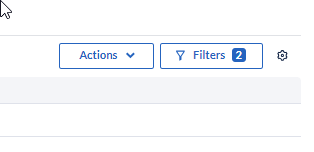
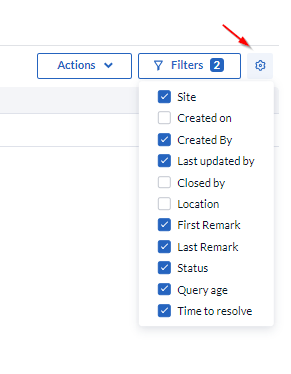
A cogwheel menu can be used to configure at any point which columns to have displayed in the 'Queries' overview.
Exporting Queries
Queries can be exported either directly from the Queries listing or as part of the Participant Data export.